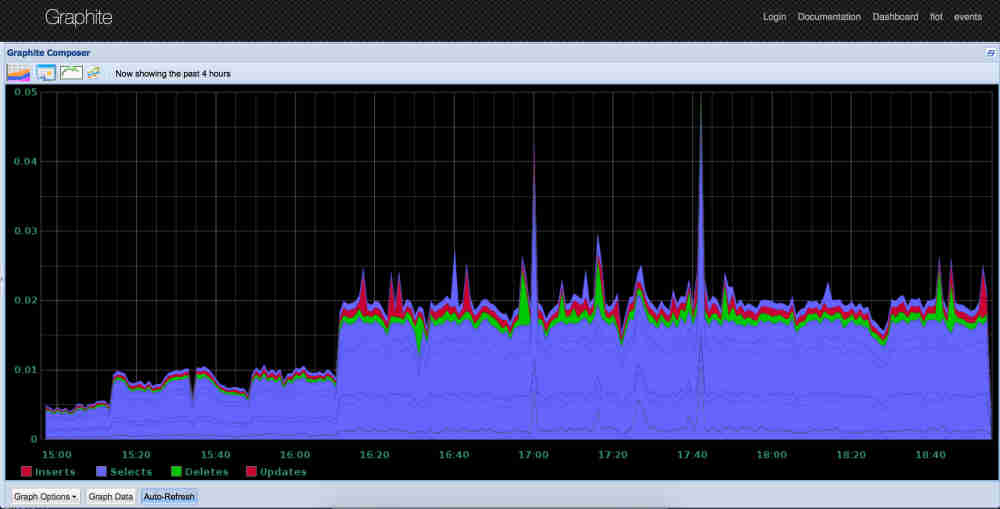
-
-
-
-
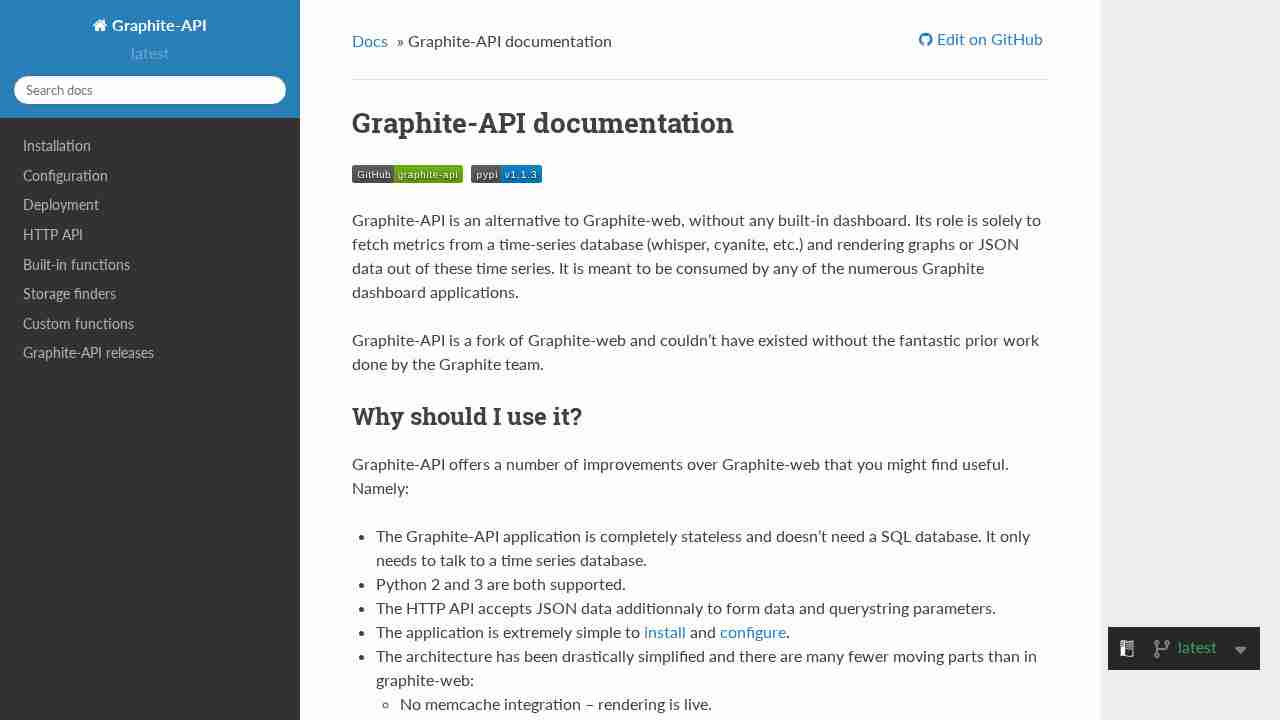
Graphite-API documentation — Graphite-API 1.1.3 documentation
August 1, 2016 - permalink - http://graphite-api.readthedocs.io/en/latest/Pour remplacer graphite-web (django) par plus léger
-
Dear Graphite Users and Developers
July 2, 2016 - permalink - https://blog.raintank.io/dear-graphite-users-and-developers/Ça c'est une très bonne nouvelle !
-
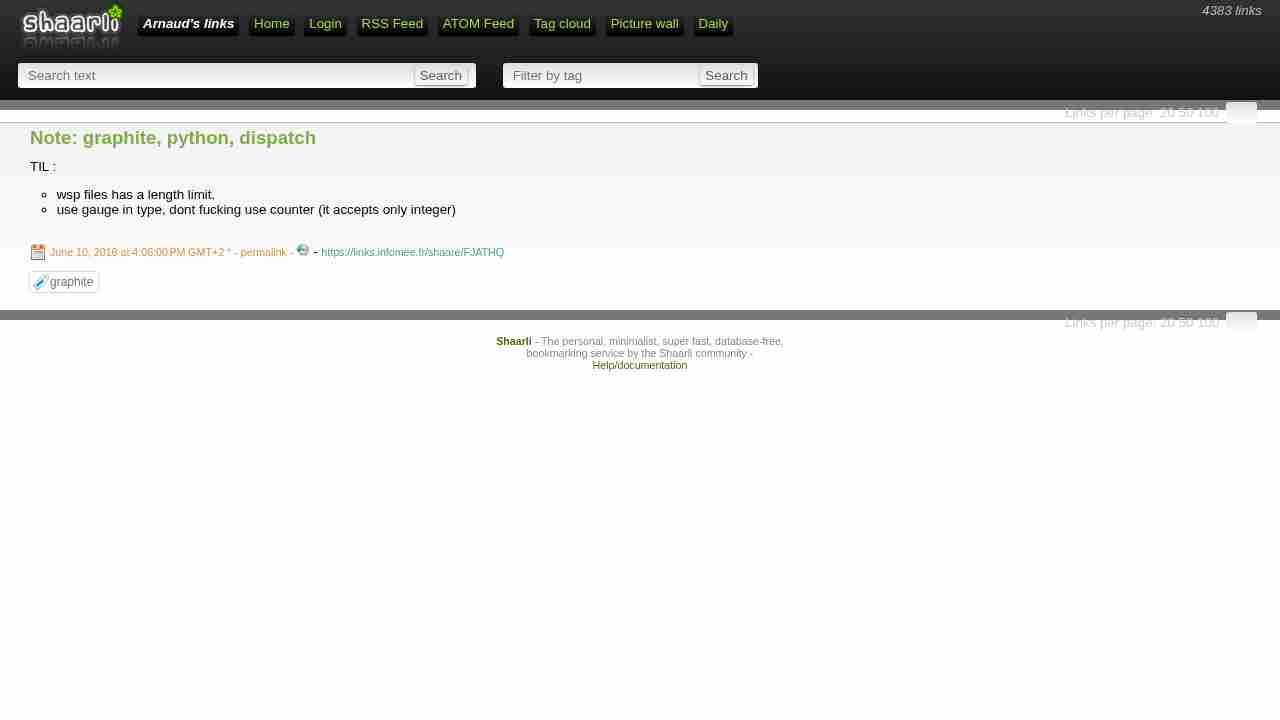
Note: graphite, python, dispatch
June 10, 2016 - permalink - https://links.infomee.fr/shaare/FJATHQTIL :
- wsp files has a length limit.
- use gauge in type, dont fucking use counter (it accepts only integer)
-
How to install Graphite as a user (non root)
May 18, 2016 - permalink - https://gist.github.com/SpOOnman/5957589[Summary, full note in Shaarli]
Install Graphite 0.9.10 as a normal user on CentOS 5.5, with no internet and no root (Tomasz Kalkosiński, refaktor.blogspot.com). Based on https://community.webfaction.com/questions/10038 and https://gist.github.com/jgeurts/3112065. Download every tarball elsewhere and upload it. Needs gcc and make (rpm -qa | grep gcc).- Environment (put in .bashrc): CFLAGS/CPPFLAGS=-I$HOME/include -I$HOME/include/python2.7, PKG_CONFIG_PATH=$HOME/lib/pkgconfig, LDFLAGS=-L$HOME/lib -L$HOME/lib/python2.7, LD_LIBRARY_PATH with $HOME/lib, $HOME/lib/python2.7 and its site-packages/cairo, PYTHONPATH with $HOME/lib/python and $HOME/lib/python2.7/site-packages, PATH=$HOME/.local/bin:$PATH. Work dir $HOME/graphite-install.
- Libraries, each with ./configure --prefix=$HOME && make && make install: zlib 1.2.8, libpng 1.6.2, sqlite 3.7.17.
- Python 2.7.5: ./configure --enable-shared --prefix=$HOME (enable-shared is crucial); make must not list _zlib or _sqlite3 as missing. Then use ~/bin/python everywhere.
- Cairo: libffi 3.0.11, glib 2.31.22, pixman 0.26.2, cairo 1.12.2 (same configure), then py2cairo 1.10.0 with ~/bin/python ./waf configure --prefix=$HOME / build / install. Check: ~/bin/python -c 'import cairo; print cairo.version'
- setup.py install --user for zope.interface 4.0.5, Django 1.5.1, django-tagging 0.3.1, Twisted 11.1.0.
- whisper, carbon, graphite-web 0.9.10: setup.py install --home=$HOME/graphite (run check-dependencies.py first).
- conf: copy carbon.conf and storage-schemas.conf from the examples; local_settings.py: TIME_ZONE, DEBUG = True, ALLOWED_HOSTS = ["*"], explicit paths instead of /opt/graphite and of $HOME (which doesn't work there), DATABASES with a full path. Then manage.py syncdb, carbon-cache.py start, manage.py runserver inside screen; curl localhost:8000; examples/example-client.py sends test stats.
-
-
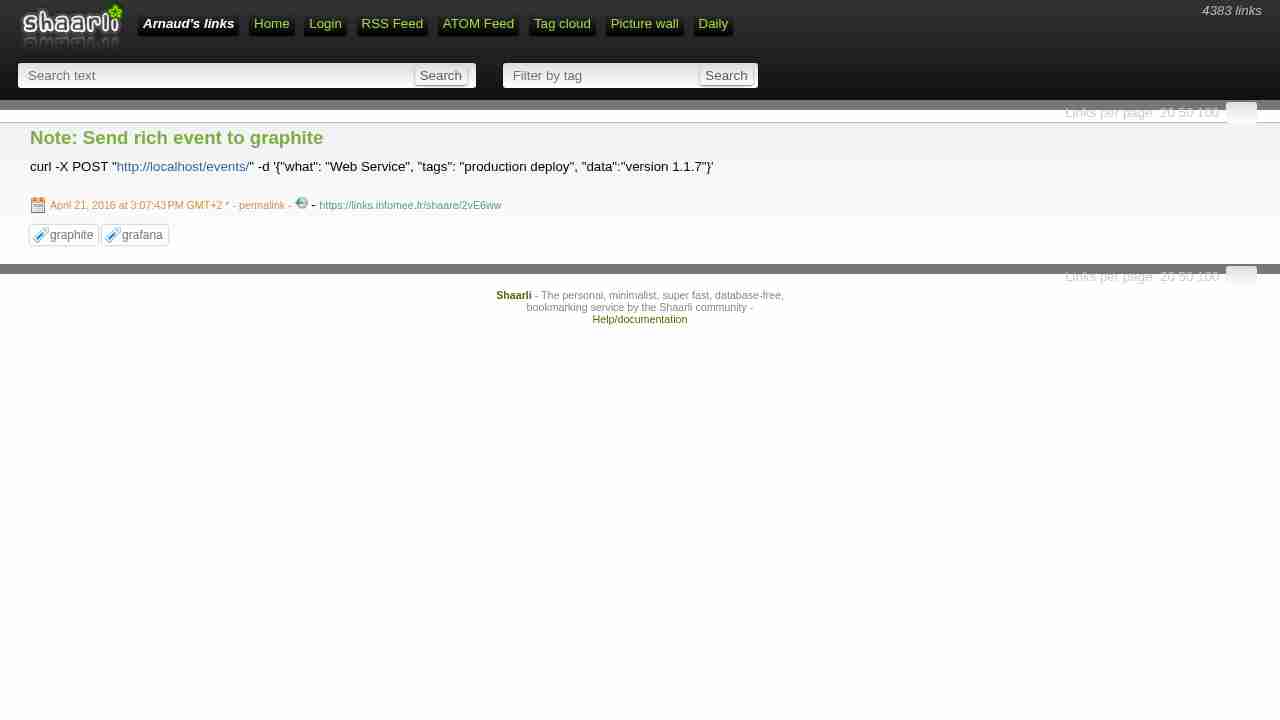
Note: Send rich event to graphite
April 21, 2016 - permalink - https://links.infomee.fr/shaare/2vE6wwcurl -X POST "http://localhost/events/" -d '{"what": "Web Service", "tags": "production deploy", "data":"version 1.1.7"}'
-
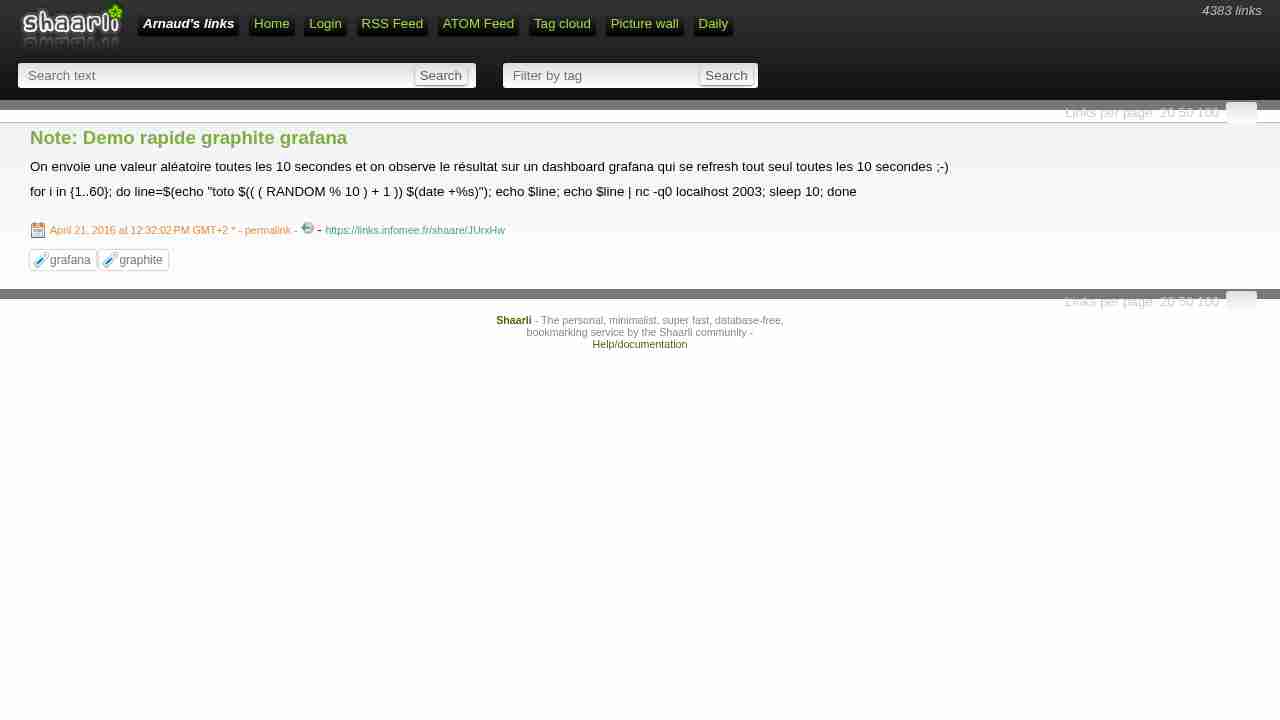
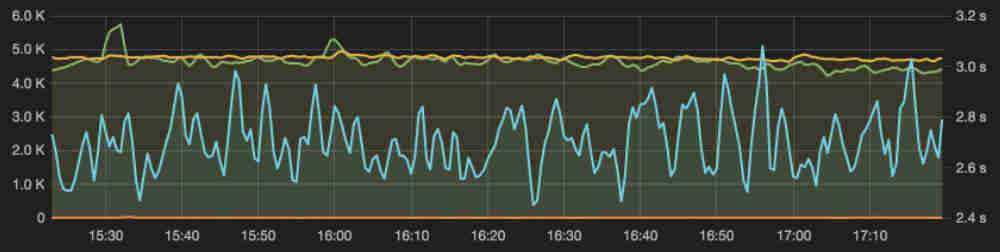
Note: Demo rapide graphite grafana
April 21, 2016 - permalink - https://links.infomee.fr/shaare/JUrxHwOn envoie une valeur aléatoire toutes les 10 secondes et on observe le résultat sur un dashboard grafana qui se refresh tout seul toutes les 10 secondes ;-)
for i in {1..60}; do line=$(echo "toto $(( ( RANDOM % 10 ) + 1 )) $(date +%s)"); echo $line; echo $line | nc -q0 localhost 2003; sleep 10; done
-
Understanding Metrics in the Age of the TSDB
April 18, 2016 - permalink - https://blog.filippo.io/understanding-metrics/La base de la métrologie avec les différents types de metric : gauge, rate, histogram.. Le rôle de statsd (buffer..)
-
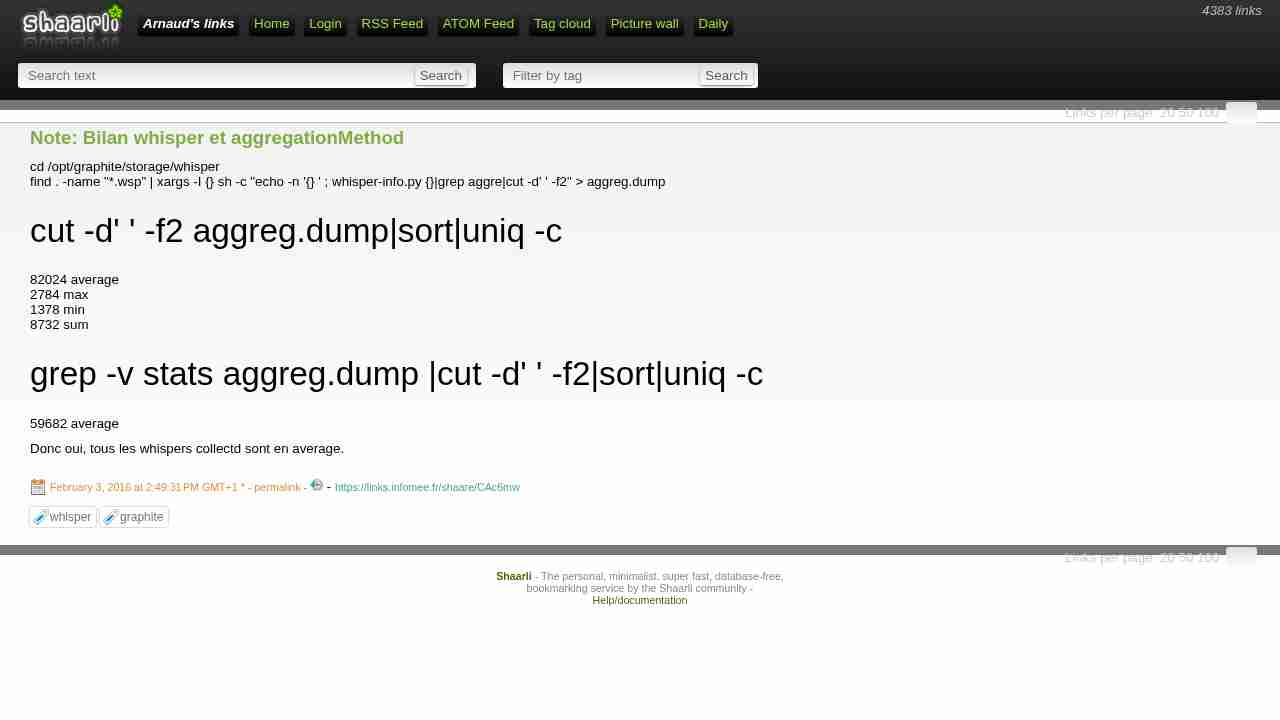
Note: Bilan whisper et aggregationMethod
February 3, 2016 - permalink - https://links.infomee.fr/shaare/CAc6mwcd /opt/graphite/storage/whisper
find . -name "*.wsp" | xargs -I {} sh -c "echo -n '{} ' ; whisper-info.py {}|grep aggre|cut -d' ' -f2" > aggreg.dumpcut -d' ' -f2 aggreg.dump|sort|uniq -c
82024 average
2784 max
1378 min
8732 sumgrep -v stats aggreg.dump |cut -d' ' -f2|sort|uniq -c
59682 average
Donc oui, tous les whispers collectd sont en average.
-
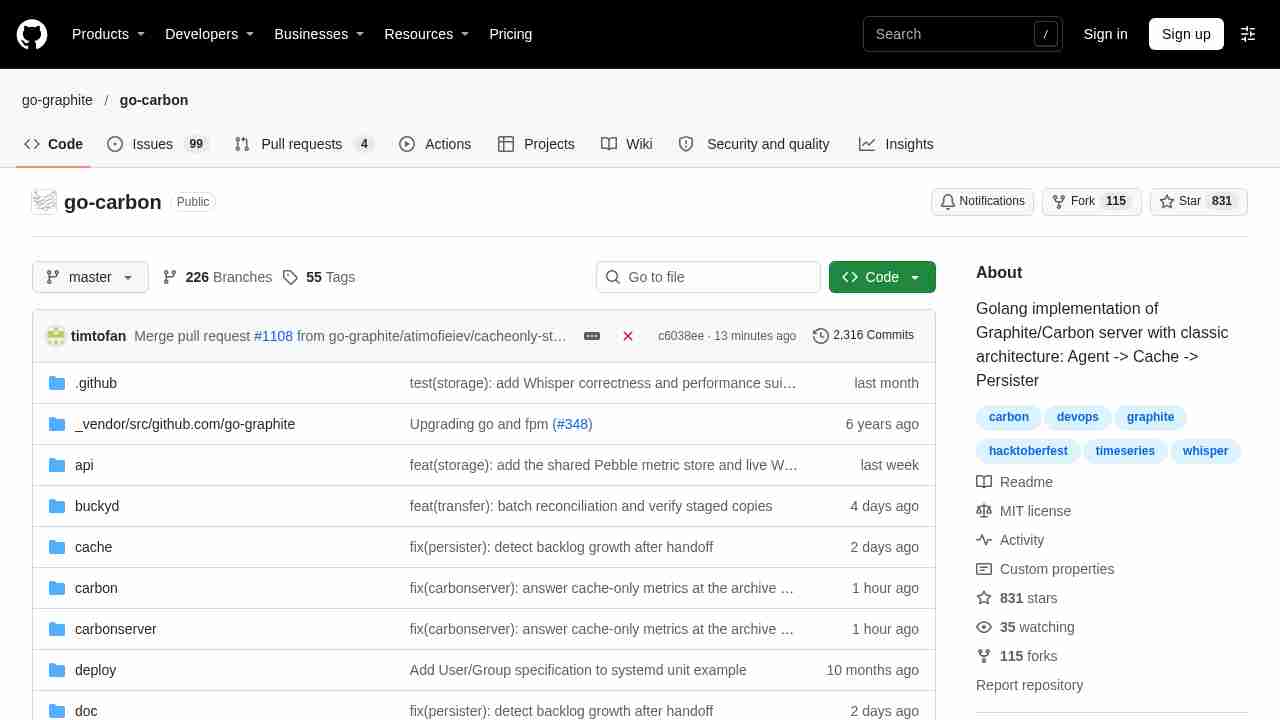
lomik/go-carbon - Go
January 18, 2016 - permalink - https://github.com/lomik/go-carbonGolang implementation of Graphite/Carbon server with classic architecture: Agent -> Cache -> Persister
used by Doo 1M metric/sec (12 CPU)
-
-
allegro.tech - Scaling Graphite
September 26, 2015 - permalink - http://allegro.tech/2015/09/scaling-graphite.htmlScaling graphite
via arnaudb
-
Grafana & ES
September 7, 2015 - permalink - https://links.infomee.fr/shaare/bFlLkQ[07:27] < torkelo>| matejz: I have managed to get about 140~ bytes per measurement (ES) asyd
[07:27] < matejz>| and was thinking of using it for metrics as well aviau
[07:27] < torkelo>| which is 12x the size requirement of Graphite (12 bytes per measurement)[10:16] < torkelo> | agree, if you store more than 100 000 metrics/s I think ES is not a good option. But for short term performance logging the new metric features for flat_white
percentile and moving average, etc are looking very good
-
Utiliser le proxy de grafana pour query graphite
April 21, 2015 - permalink - https://links.infomee.fr/shaare/5zIN_wUn get la dessus : /api/datasources/proxy/1/metrics/find/?query=collectd.*
-
-
-
-
-
-
kairosdb/kairosdb
November 14, 2014 - permalink - https://github.com/kairosdb/kairosdbIl existe plusieurs alternatives à carbon, la plus connu étant surement influxdb. Celle ci est basée sur cassandra!
+https://github.com/kairosdb/kairos-carbon
via arnaudb
-
Question #170794 : Questions : Graphite
October 24, 2014 - permalink - https://answers.launchpad.net/graphite/+question/170794Encore une discussion intéressante sur les perf de graphite. Ce qu'il faut retenir c'est que le botteneck peut se situer au niveau du CPU ou au niveau du disque (la RAM en général ce n'est pas un probleme, meme si bien sur, il faut la surveiller)
Pour connaitre l'utilisation du CPU de carbon-cache, une metric est envoyé par le daemon dans carbon.agents.graphite-x.cpuUsage
Pour connaitre l'utilisation du disk, on se sert de iostat -dmx 1 2 (merci arnaud)
Si le disque est trop haut (entre 50 et 75), il faut le soulager en baissant dans la conf de carbon le max update par seconde.
Ce qui aura pour effet d'augmenter la taille du cache et donc de faire plus travailler le CPU..
Au contraire si le CPU est chargé mais que le disque ne fait rien, il faut augmenter le max update par seconde.
En trouvant le bon équilibre on peut exploiter au maximum le hardware disponible
-
-
-
yeah.png (Image PNG, 3840 × 1080 pixels)
October 7, 2014 - permalink - https://files.gitter.im/grafana/grafana/trFy/yeah.pngUn screenshot d'un dashboard qu'il est bien
-
notes from the fields: Scripting Grafana dashboards
October 3, 2014 - permalink - http://anatolijd.blogspot.fr/2014/07/scripting-grafana-dashboards.htmlà lire pour le monitoring applicatif
-
-
cyanite
September 23, 2014 - permalink - http://cyanite.io/front end graphite avec un backend cassandra (carrément)
via arnaudb
-
Init script for Graphite carbon-cache
September 11, 2014 - permalink - https://gist.github.com/chalmerj/1492384[Summary, full note in Shaarli]
Init script (/etc/init.d/carbon-cache) for Graphite's carbon-cache daemon, by Jeremy Chalmer, written for Ubuntu 11.10 with start-stop-daemon.- LSB header: Provides carbon-cache, Required-Start/Stop $remote_fs $syslog, Default-Start 2 3 4 5, Default-Stop 0 1 6.
- Enable with: update-rc.d carbon-cache defaults
- Set USER in /opt/graphite/conf/carbon.conf to the owner of /opt/graphite/storage/: carbon-cache runs as that user.
- GRAPHITE_HOME=/opt/graphite, DAEMON=$GRAPHITE_HOME/bin/carbon-cache.py, hard-coded PIDFILE=/opt/graphite/storage/carbon-cache-a.pid (adapt if several carbon-cache instances run). Exits 99 if the daemon isn't executable. Carbon logs in /opt/graphite/storage/log/carbon-cache-*.
- do_start: start-stop-daemon --start --pidfile $PIDFILE --exec $DAEMON --test -- start (already running = 1), then the real start (failure = 2).
- do_stop: start-stop-daemon --stop --signal 2 --retry 5 --quiet --pidfile $PIDFILE, then remove the PID file.
- Actions: start, stop, restart (stop then start), status (kill -0 on the PID from the PID file); otherwise usage {start|stop|restart|status}, exit 3.
-
Low Level Manager: Monitorama Conference
August 30, 2014 - permalink - http://www.lowlevelmanager.com/2014/07/monitorama-conference.htmlà regarder à la rentrée
via arnaudb
-
-
Tracking Every Release « Code as Craft
August 6, 2014 - permalink - http://codeascraft.com/2010/12/08/track-every-release/apply function > Special > draw non zero as infinite
-
Configuration graphite pour être utilisé avec statsd
August 1, 2014 - permalink - https://github.com/etsy/statsd/blob/master/docs/graphite.mdAide à comprendre pas mal de chose concernant graphite/statsd
-
https://github.com/graphite-project/whisper
August 1, 2014 - permalink - https://github.com/graphite-project/whisperSuite d'outils bien pratique pour tester/vérifier/debug ses whisper files, en particulier whisper-dump et whisper-fetch
-
whisper calculator
July 24, 2014 - permalink - https://gist.github.com/jjmaestro/5774063#file-whisper-calculator-py!/usr/bin/env python
-- coding: utf-8 --
def archive_to_bytes(archive):
def to_seconds(s):
SECONDS_IN_A = {
's': 1,
'm': 1 * 60,
'h': 1 * 60 * 60,
'd': 1 * 60 * 60 * 24,
'y': 1 * 60 * 60 * 24 * 365,
}return int(s[:-1]) * SECONDS_IN_A[s[-1]] archive = [map(to_seconds, point.split(':')) for point in args.archive.split(',')] SIZE_METADATA = 2 * 4 + 4 + 4 # 16 [!2LfL] SIZE_ARCHIVE_INFO = 3 * 4 # 12 [!3L]+ SIZE_POINT = 4 + 8 # 12 [!Ld]+ size = 0 for resolution, retention in archive: size += SIZE_ARCHIVE_INFO + SIZE_POINT * retention/resolution if size: size += SIZE_METADATA return sizeif name == 'main':
import argparseparser = argparse.ArgumentParser( description="Calculates the size of the whisper storage for the given \ archive (in resolution:retention format, e.g. 1m:24h,5m:3m)" ) parser.add_argument( 'archive', help="Archive in storage-schemas.conf format (resolution:retention)" ) args = parser.parse_args() print "{} >> {} bytes".format(args.archive, archive_to_bytes(args.archive))
-
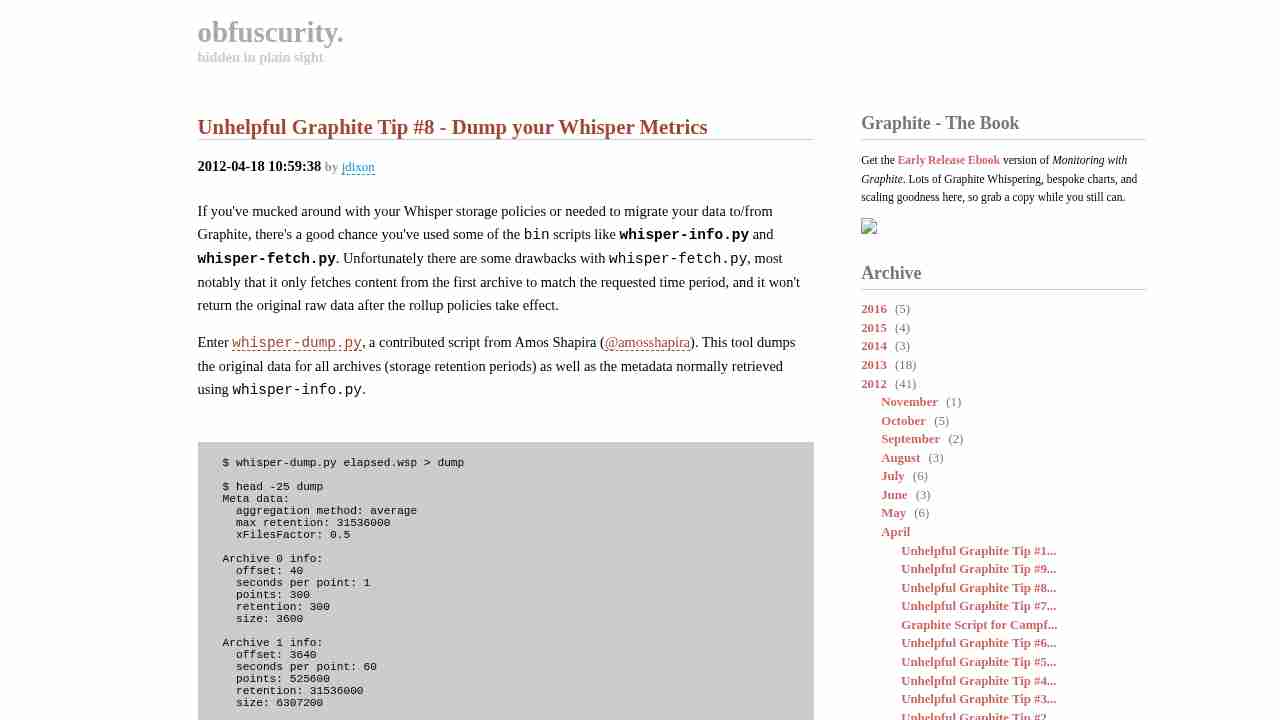
whisper dump
July 24, 2014 - permalink - http://bazaar.launchpad.net/~amos-shapira/graphite/whisper-dump/revision/733#whisper/bin/whisper-dump.py[Summary, full note in Shaarli]
whisper-dump.py : script Python 2 qui affiche le contenu brut d'un fichier whisper (.wsp) de Graphite. Usage : whisper-dump.py path- Nécessite le module whisper ; ignore SIGPIPE pour pouvoir piper la sortie (head, less...).
- Ouvre le fichier en lecture seule avec mmap.
- read_header : struct.unpack(whisper.metadataFormat) donne aggregationType, maxRetention, xFilesFactor, archiveCount ; puis, pour chaque archive, whisper.archiveInfoFormat donne offset, secondsPerPoint, points (retention = secondsPerPoint * points, size = points * whisper.pointSize).
- Affiche les métadonnées (aggregation method, max retention, xFilesFactor) et l'en-tête de chaque archive.
- dump_archives : pour chaque archive, lit chaque point avec whisper.pointFormat et affiche "index: timestamp, valeur".
- Erreur si le fichier n'existe pas ; CorruptWhisperFile si l'en-tête ne se lit pas.
-
-
-
Question #54887 : Questions : Graphite
July 22, 2014 - permalink - https://answers.launchpad.net/graphite/+question/54887In order to save graphs under 'My Graphs' and 'User Graphs' you simply need to log into Graphite and the Save/Delete buttons will then appear on the top of the Composer window. To log in you need to either create an account for yourself in the Django database or setup LDAP authentication. LDAP authentication is setup through local_settings.py, check out the example file's comments for details on doing that (or just ask if you run into any issues). However if you're not using LDAP its pretty easy to create a local user in Django's database using the Django admin interface.
When you first installed Graphite there was a step where you had to initialize the database by running 'manage.py syncdb'. That prompted you to create an admin user, if you did that already you're good to go. Otherwise you need to create an admin user by running 'manage.py createsuperuser'.
Once your admin user is setup you can go to the django admin interface by visiting http://my-graphite-server/admin/ (note: the trailing slash is required!) and logging in as your admin user. From there you need to create a new user account by clicking 'Add' under the 'Users' section. After that, go back to the main Graphite page. You may need to logout if it thinks you're still the admin user. Then log back in as you're new user and you should be able to save graphs! Also once logged in you have the ability to set profile options. Currently there is only 1 option, the "advanced UI features" option. Enabling that puts a '*' element in every folder that has more than one element, making it easier to use wildcards when you build graphs.
Hope that helps.
-
-
https://github.com/ClockworkNet/graphite-dashgen
June 24, 2014 - permalink - https://github.com/ClockworkNet/graphite-dashgendash auto via collectd dashgen
via arnaudb
-
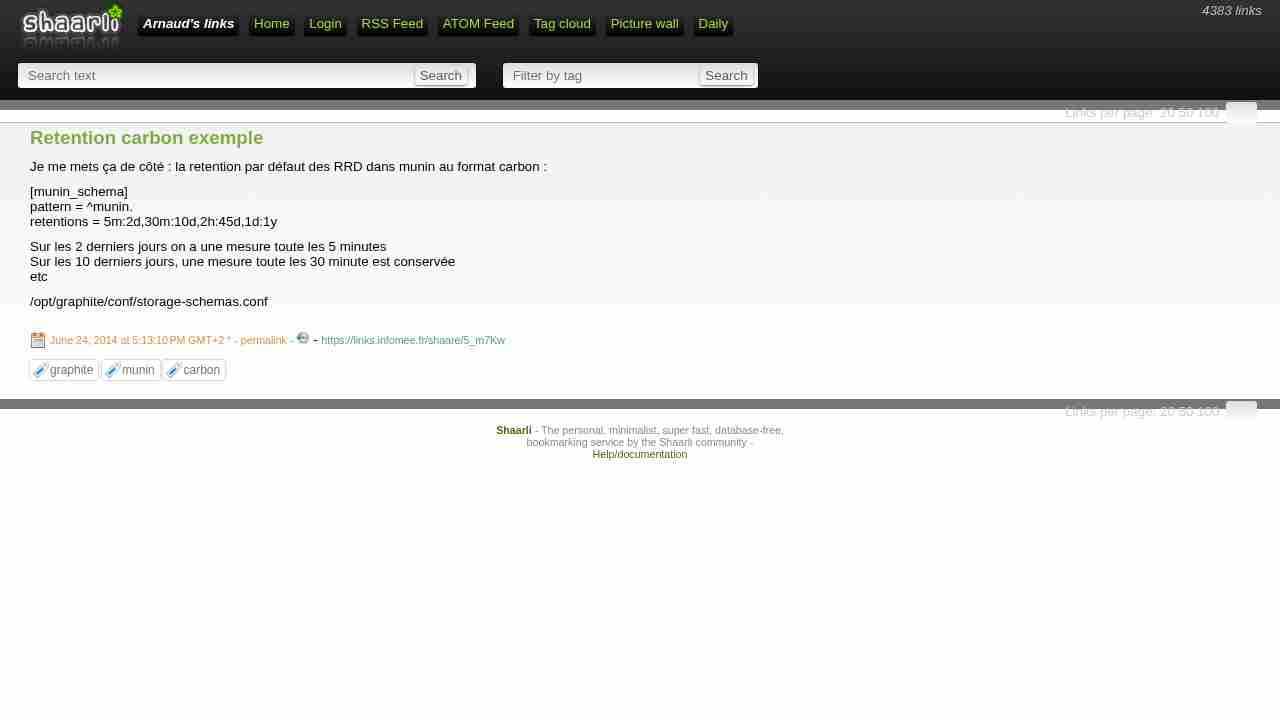
Retention carbon exemple
June 24, 2014 - permalink - https://links.infomee.fr/shaare/5_m7KwJe me mets ça de côté : la retention par défaut des RRD dans munin au format carbon :
[munin_schema]
pattern = ^munin.
retentions = 5m:2d,30m:10d,2h:45d,1d:1ySur les 2 derniers jours on a une mesure toute les 5 minutes
Sur les 10 derniers jours, une mesure toute les 30 minute est conservée
etc/opt/graphite/conf/storage-schemas.conf
-
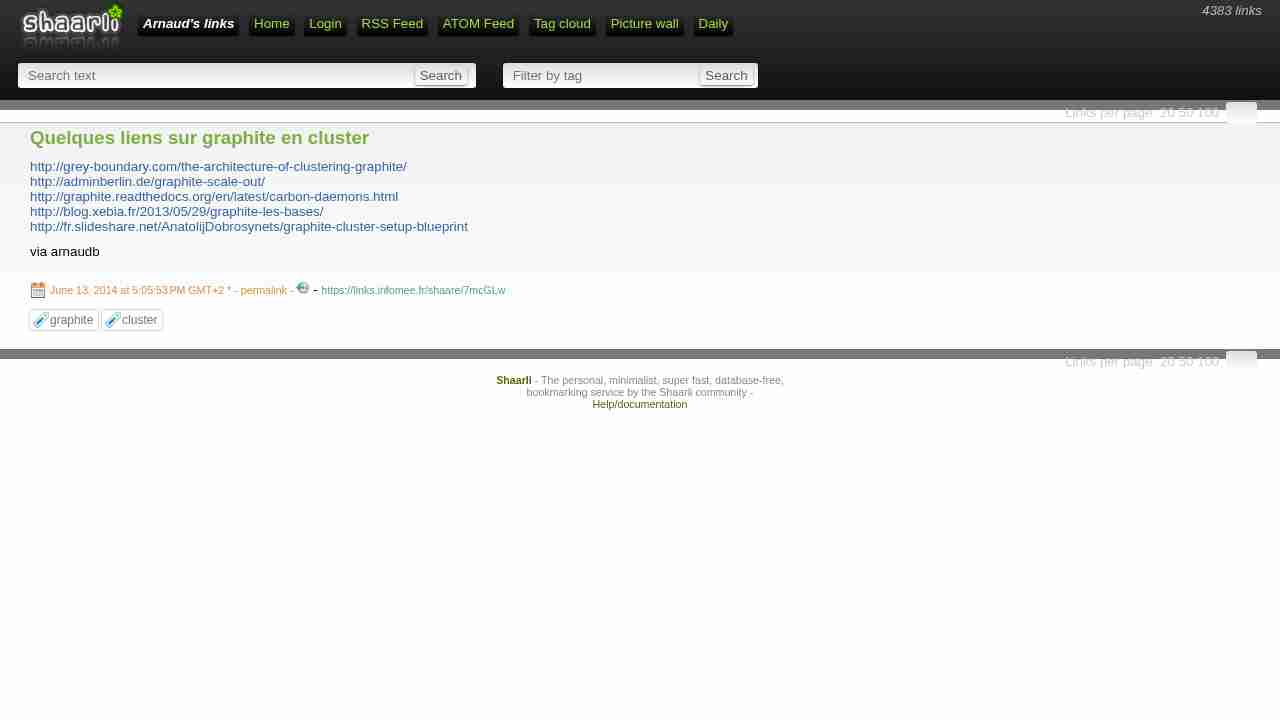
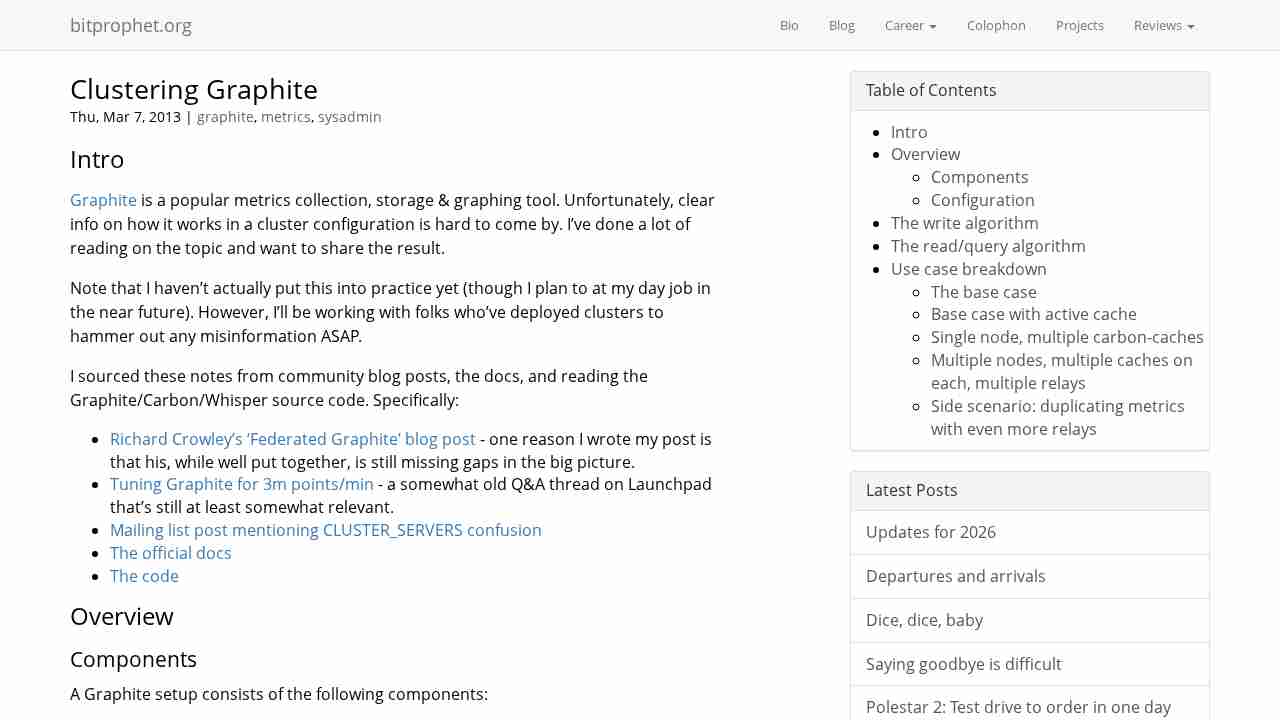
Quelques liens sur graphite en cluster
June 13, 2014 - permalink - https://links.infomee.fr/shaare/7mcGLwhttp://grey-boundary.com/the-architecture-of-clustering-graphite/
http://adminberlin.de/graphite-scale-out/
http://graphite.readthedocs.org/en/latest/carbon-daemons.html
http://blog.xebia.fr/2013/05/29/graphite-les-bases/
http://fr.slideshare.net/AnatolijDobrosynets/graphite-cluster-setup-blueprintvia arnaudb
-
-
-
Grafana Scripted dashboards
March 21, 2014 - permalink - https://github.com/torkelo/grafana/wiki/Scripted-dashboardsIf you have lots of metric names that change (new servers etc) in a defined pattern it is irritating to constantly have to create new dashboards.
With scripted dashboards you can dynamically create your dashboards using javascript. In the folder grafana install folder app/dashboards/ there is a file named scripted.js. This file contains an example of a scripted dashboard. You can access it by using the url:
http://grafana_url/#/dashboard/script/scripted.js?rows=3&name=myNameIf you open scripted.js you can see how it reads url paramters from ARGS variable and then adds rows and panels.
-
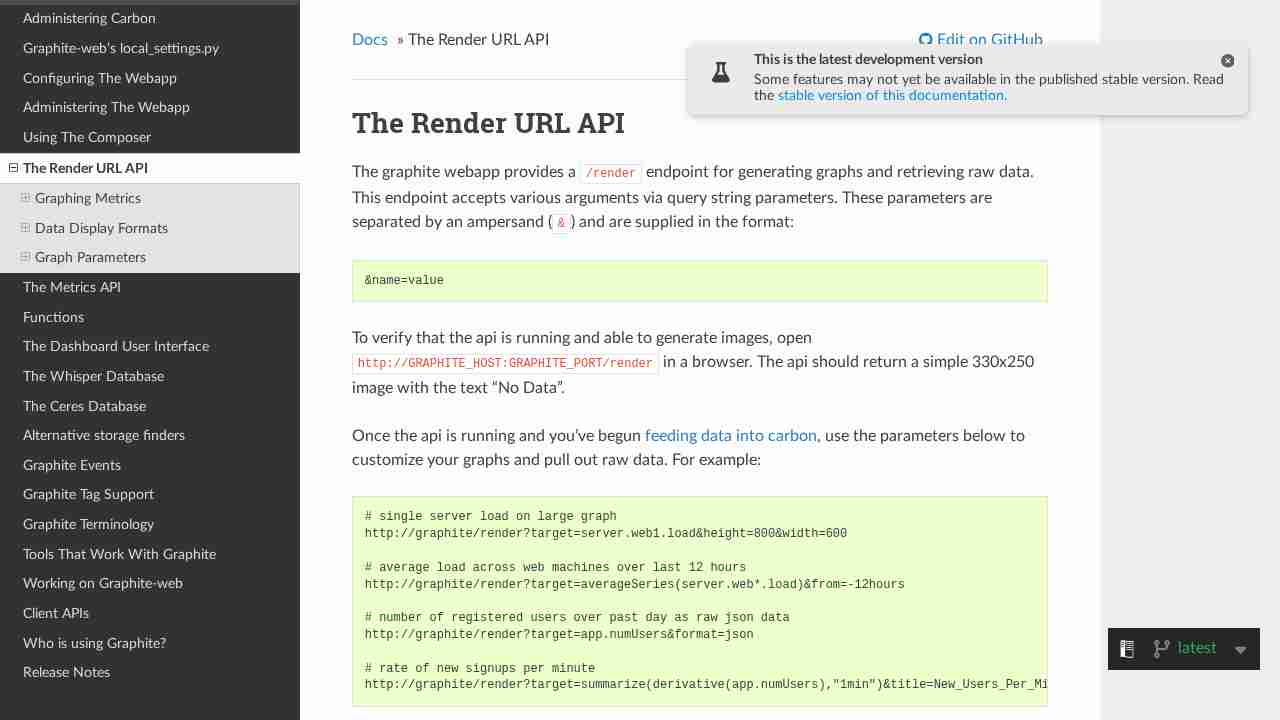
The Render URL API — Graphite 0.10.0 documentation
March 18, 2014 - permalink - http://graphite.readthedocs.org/en/latest/render_api.htmlAvec ça possible de faire des templates de graph
-
metrics - Why use statsd when graphite's Carbon aggregator can do the same job? - Stack Overflow
March 6, 2014 - permalink - http://stackoverflow.com/questions/13697553/why-use-statsd-when-graphites-carbon-aggregator-can-do-the-same-jobPourquoi utiliser statsd en plus de graphite ?
Pour scale ? car stats reçoit en udp, attend un moment, puis envoie à graphite.
Mais Carbon semble pouvoir recevoir lui aussi directement en udp..
Pour répartir la charge tout simplement ? à voir..