-
Cortex v1.0 released: The highly scalable, fast Prometheus implementation is generally available for production use | Grafana Labs
April 2, 2020 - permalink - https://grafana.com/blog/2020/04/02/cortex-v1.0-released-the-highly-scalable-fast-prometheus-implementation-is-generally-available-for-production-use/
-
GitHub - utkarshcmu/wizzy: Manage Grafana entities with easy wizzy
December 4, 2016 - permalink - https://github.com/utkarshcmu/wizzy#local-commandswow une cli pour editer les dashboards grafana.. ça peut servir par exemple pour dupliquer des variables de template d'un dashboard à X autres
-
-
Note: Send rich event to graphite
April 21, 2016 - permalink - https://links.infomee.fr/shaare/2vE6wwcurl -X POST "http://localhost/events/" -d '{"what": "Web Service", "tags": "production deploy", "data":"version 1.1.7"}'
-
Note: Demo rapide graphite grafana
April 21, 2016 - permalink - https://links.infomee.fr/shaare/JUrxHwOn envoie une valeur aléatoire toutes les 10 secondes et on observe le résultat sur un dashboard grafana qui se refresh tout seul toutes les 10 secondes ;-)
for i in {1..60}; do line=$(echo "toto $(( ( RANDOM % 10 ) + 1 )) $(date +%s)"); echo $line; echo $line | nc -q0 localhost 2003; sleep 10; done
-
-
Grafana & ES
September 7, 2015 - permalink - https://links.infomee.fr/shaare/bFlLkQ[07:27] < torkelo>| matejz: I have managed to get about 140~ bytes per measurement (ES) asyd
[07:27] < matejz>| and was thinking of using it for metrics as well aviau
[07:27] < torkelo>| which is 12x the size requirement of Graphite (12 bytes per measurement)[10:16] < torkelo> | agree, if you store more than 100 000 metrics/s I think ES is not a good option. But for short term performance logging the new metric features for flat_white
percentile and moving average, etc are looking very good
-
Bug Grafana
July 31, 2015 - permalink - https://links.infomee.fr/shaare/amIfTQcss/grafana.dark.min.5aa0b879.css
.histogram-chart{min-height:250px;
-
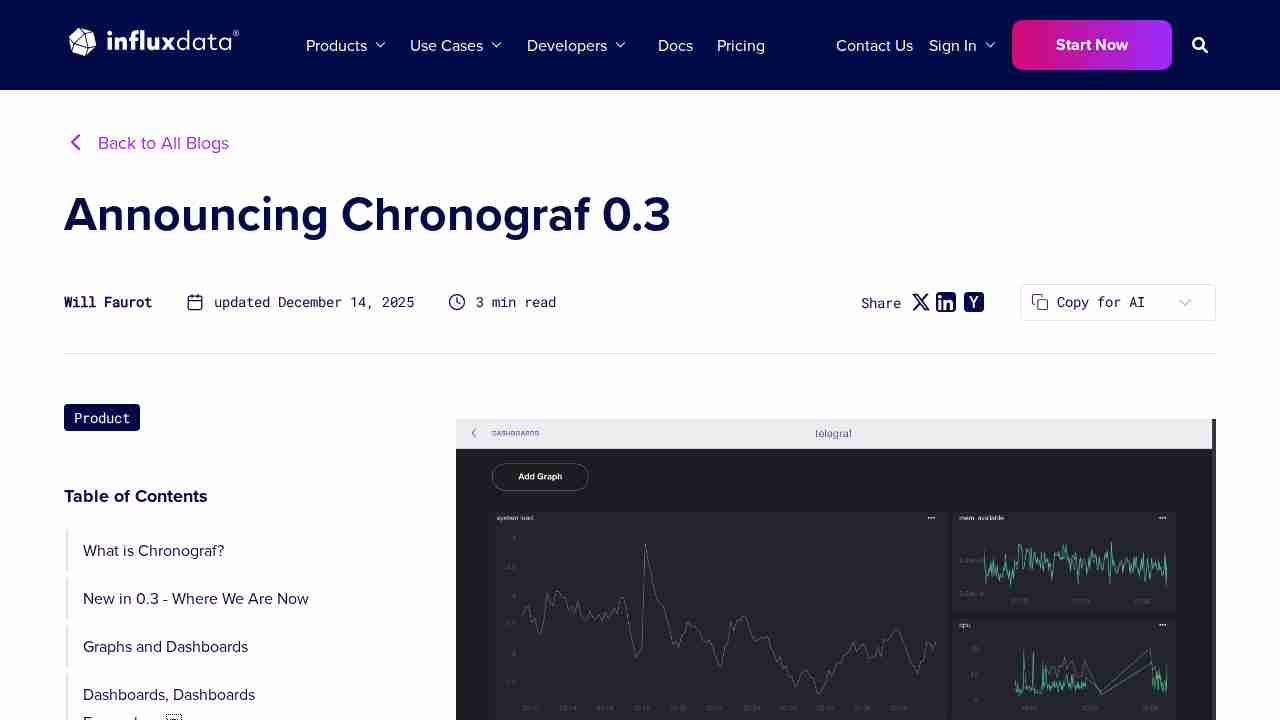
Announcing Chronograf, A Data Visualization Tool For InfluxDB | InfluxDB
July 17, 2015 - permalink - https://influxdb.com/blog/2015/07/07/Announcing-Chronograf-a-data-visualization-tool-for-InfluxDB.htmlUne web interface pour visualiser les data dans influxdb (par influxdb)
Petite concurrence à Grafana pour le coup
-
Utiliser le proxy de grafana pour query graphite
April 21, 2015 - permalink - https://links.infomee.fr/shaare/5zIN_wUn get la dessus : /api/datasources/proxy/1/metrics/find/?query=collectd.*
-
yeah.png (Image PNG, 3840 × 1080 pixels)
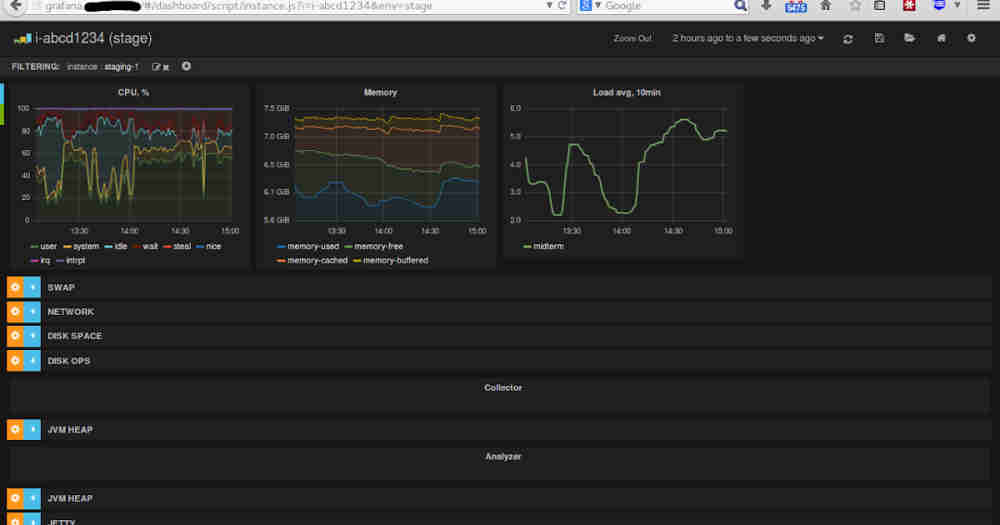
October 7, 2014 - permalink - https://files.gitter.im/grafana/grafana/trFy/yeah.pngUn screenshot d'un dashboard qu'il est bien
-
notes from the fields: Scripting Grafana dashboards
October 3, 2014 - permalink - http://anatolijd.blogspot.fr/2014/07/scripting-grafana-dashboards.htmlà lire pour le monitoring applicatif
-
Grafana Scripted dashboards
March 21, 2014 - permalink - https://github.com/torkelo/grafana/wiki/Scripted-dashboardsIf you have lots of metric names that change (new servers etc) in a defined pattern it is irritating to constantly have to create new dashboards.
With scripted dashboards you can dynamically create your dashboards using javascript. In the folder grafana install folder app/dashboards/ there is a file named scripted.js. This file contains an example of a scripted dashboard. You can access it by using the url:
http://grafana_url/#/dashboard/script/scripted.js?rows=3&name=myNameIf you open scripted.js you can see how it reads url paramters from ARGS variable and then adds rows and panels.
-
Grafana - Graphite Dashboard
January 24, 2014 - permalink - http://grafana.org/Un frontend pour graphite, sympa!
via Skunnyk